What gets captured
Every report can arrive with the answers to the questions you'd otherwise have to email back and forth about — and a short list of things BugClip never touches.
“What browser were you on?” “Was there anything in the console?” “What did you click before it broke?” Those emails are the reason a five-minute bug takes three days. BugClip answers them in the report.
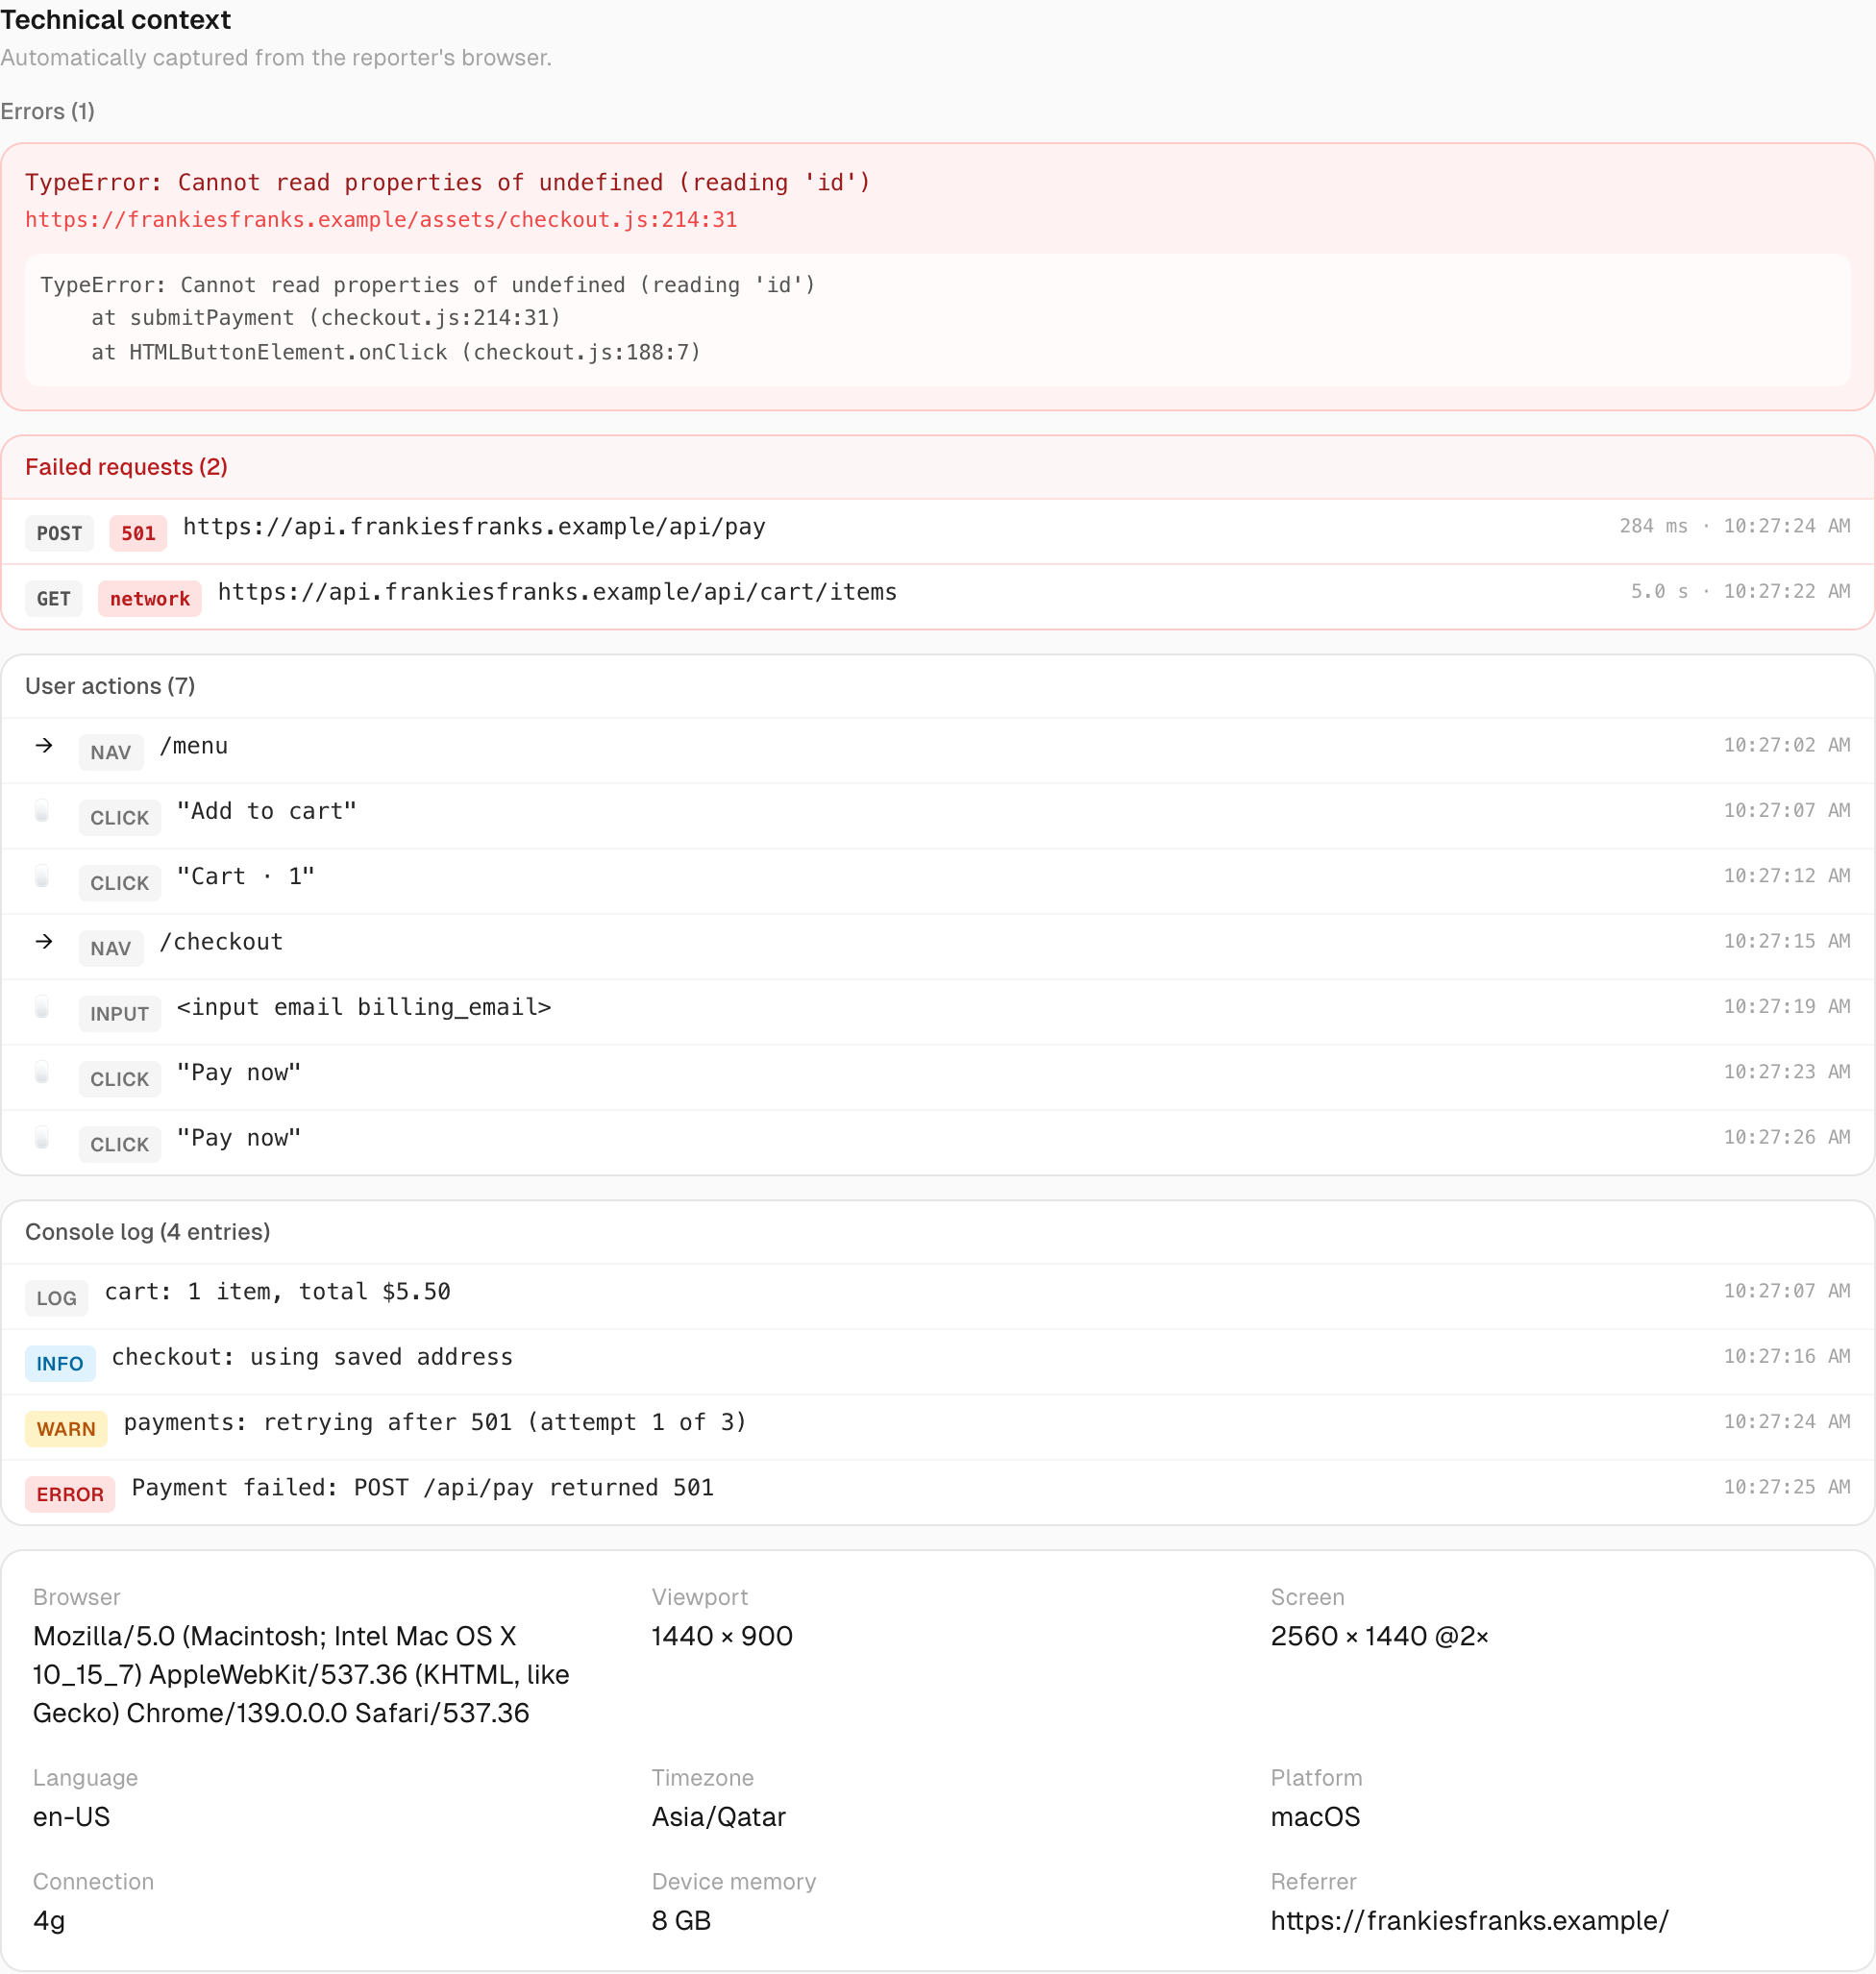
What comes with a report
- Console messages — the last 100 lines the page logged, with timestamps.
- Errors — up to 30 JavaScript errors, each with its message and the stack trace showing where it came from.
- Failed requests — up to 30 network calls that came back
4xxor5xx(the status codes for “not found”, “not allowed”, “server error” and friends) or failed to connect at all. You get the method, URL, status code, and how long it took. - What they clicked — a trail of up to 40 steps: clicks, form submits, and page changes, so you can retrace how they got there.
- Their setup — browser, window and screen size, language, timezone, platform, connection speed, device memory, the page URL, and where they came from.
Those numbers — 100, 30, 30, 40 — are why this stays cheap. Each one is a rolling buffer: a list that holds only the most recent entries and drops the oldest as new ones arrive. It never grows, so a tab left open all afternoon costs the same as one opened a minute ago. When someone sends a report, BugClip takes a copy of whatever is in those lists at that instant.
Nothing leaves the browser unless a report is actually sent. Close the tab without reporting and all of it disappears.
What is never captured
These are deliberate limits, not features we haven't built yet. The widget runs on your customers' site, and their visitors' data isn't ours to take:
- Request bodies and headers — so no auth tokens, no API payloads. You get the URL and the status code, not the contents.
- Anything typed into a form — the click trail records which field was used, never what went into it.
- Cookies and stored data.
- Any background recording. There is no always-on session replay. Capture begins when the reporter clicks, and not before.
Where you'll see it
Open any report and scroll to Technical context. Errors come first, then failed requests, then the click trail, then the console log (folded up, since it's usually long), and finally their browser and device details.
Slack messages carry a one-line version of it, like 1 console error · 2 failed requests, so you can tell at a glance whether a report is worth opening now.